

About
Visualization MCP Server
README
A powerful Model Context Protocol (MCP) server for creating interactive data visualizations using matplotlib. This server provides comprehensive visualization tools including relationship graphs, scatter plots, 3D visualizations, and more.
Features
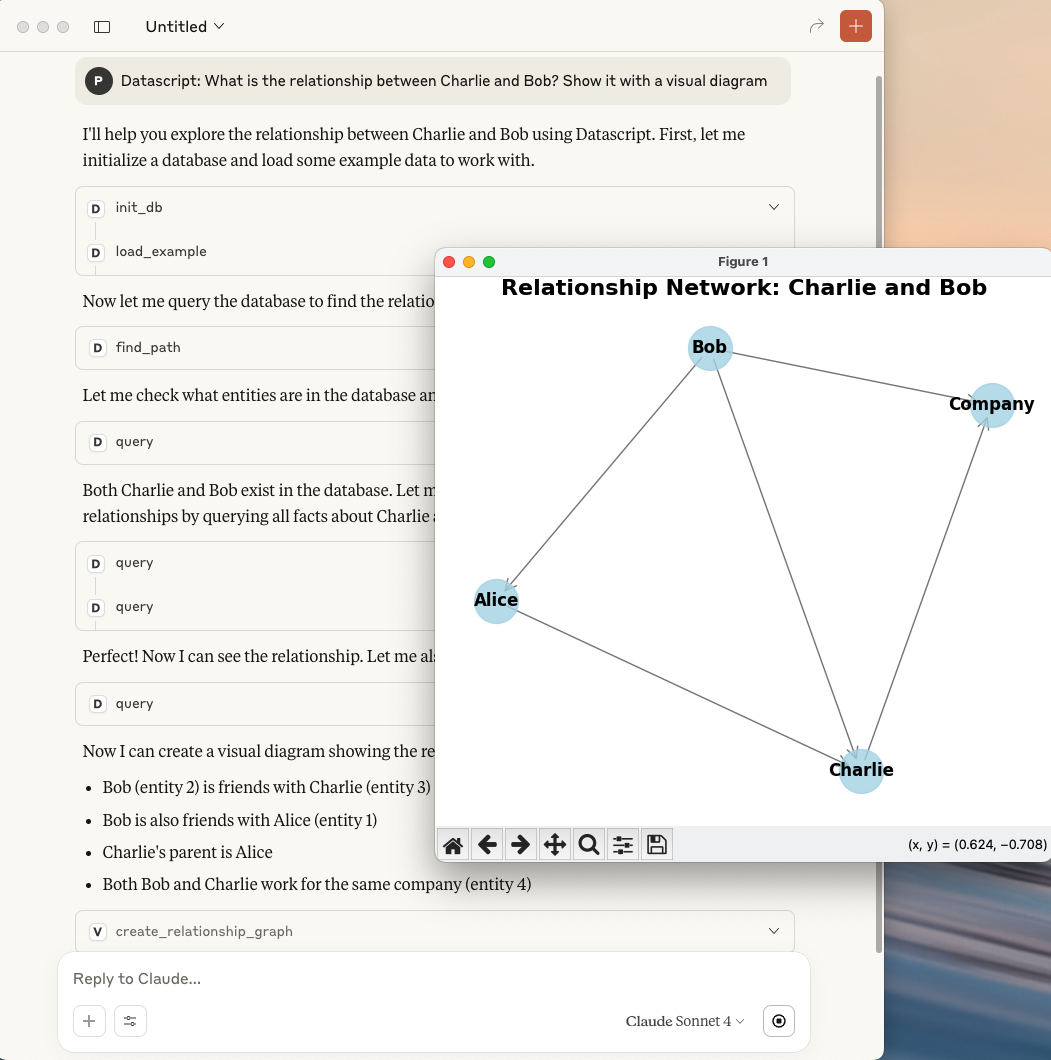
- 🔗 Relationship Graphs: Create network diagrams to visualize connections between entities
- 📊 Scatter Plots: Basic and classification scatter plots with customizable styling
- 🌐 3D Visualizations: Support for 3D scatter plots, surface plots, and wireframes
- 📈 Statistical Charts: Histograms, line plots, and heatmaps
- 💾 Auto-save: Automatically saves high-resolution images to temporary directory
- 🖼️ Live Display: Shows plots in interactive matplotlib windows
- 🎨 Customizable: Extensive styling options for colors, labels, and layouts
Installation
Prerequisites
$ python3 -m venv .venv --upgrade-deps

$ source .venv/bin/activate

$ pip install "mcp[cli]" httpx

$ pip install   matplotlib numpy pandas networkx
Clone and Run
git clone https://github.com/xlisp/visualization-mcp-server.git
cd visualization-mcp-server
python visualization_server.py
Usage
1. Cladue Desktop Client Config
    "visualization": {
      "command": "/Users/clojure/Desktop/visualization-mcp-server/.venv/bin/python",
      "args": [
        "/Users/clojure/Desktop/visualization-mcp-server/visualization_server.py"
      ]
    }
The server provides several visualization tools that can be called via MCP protocol:
1. Relationship Graph
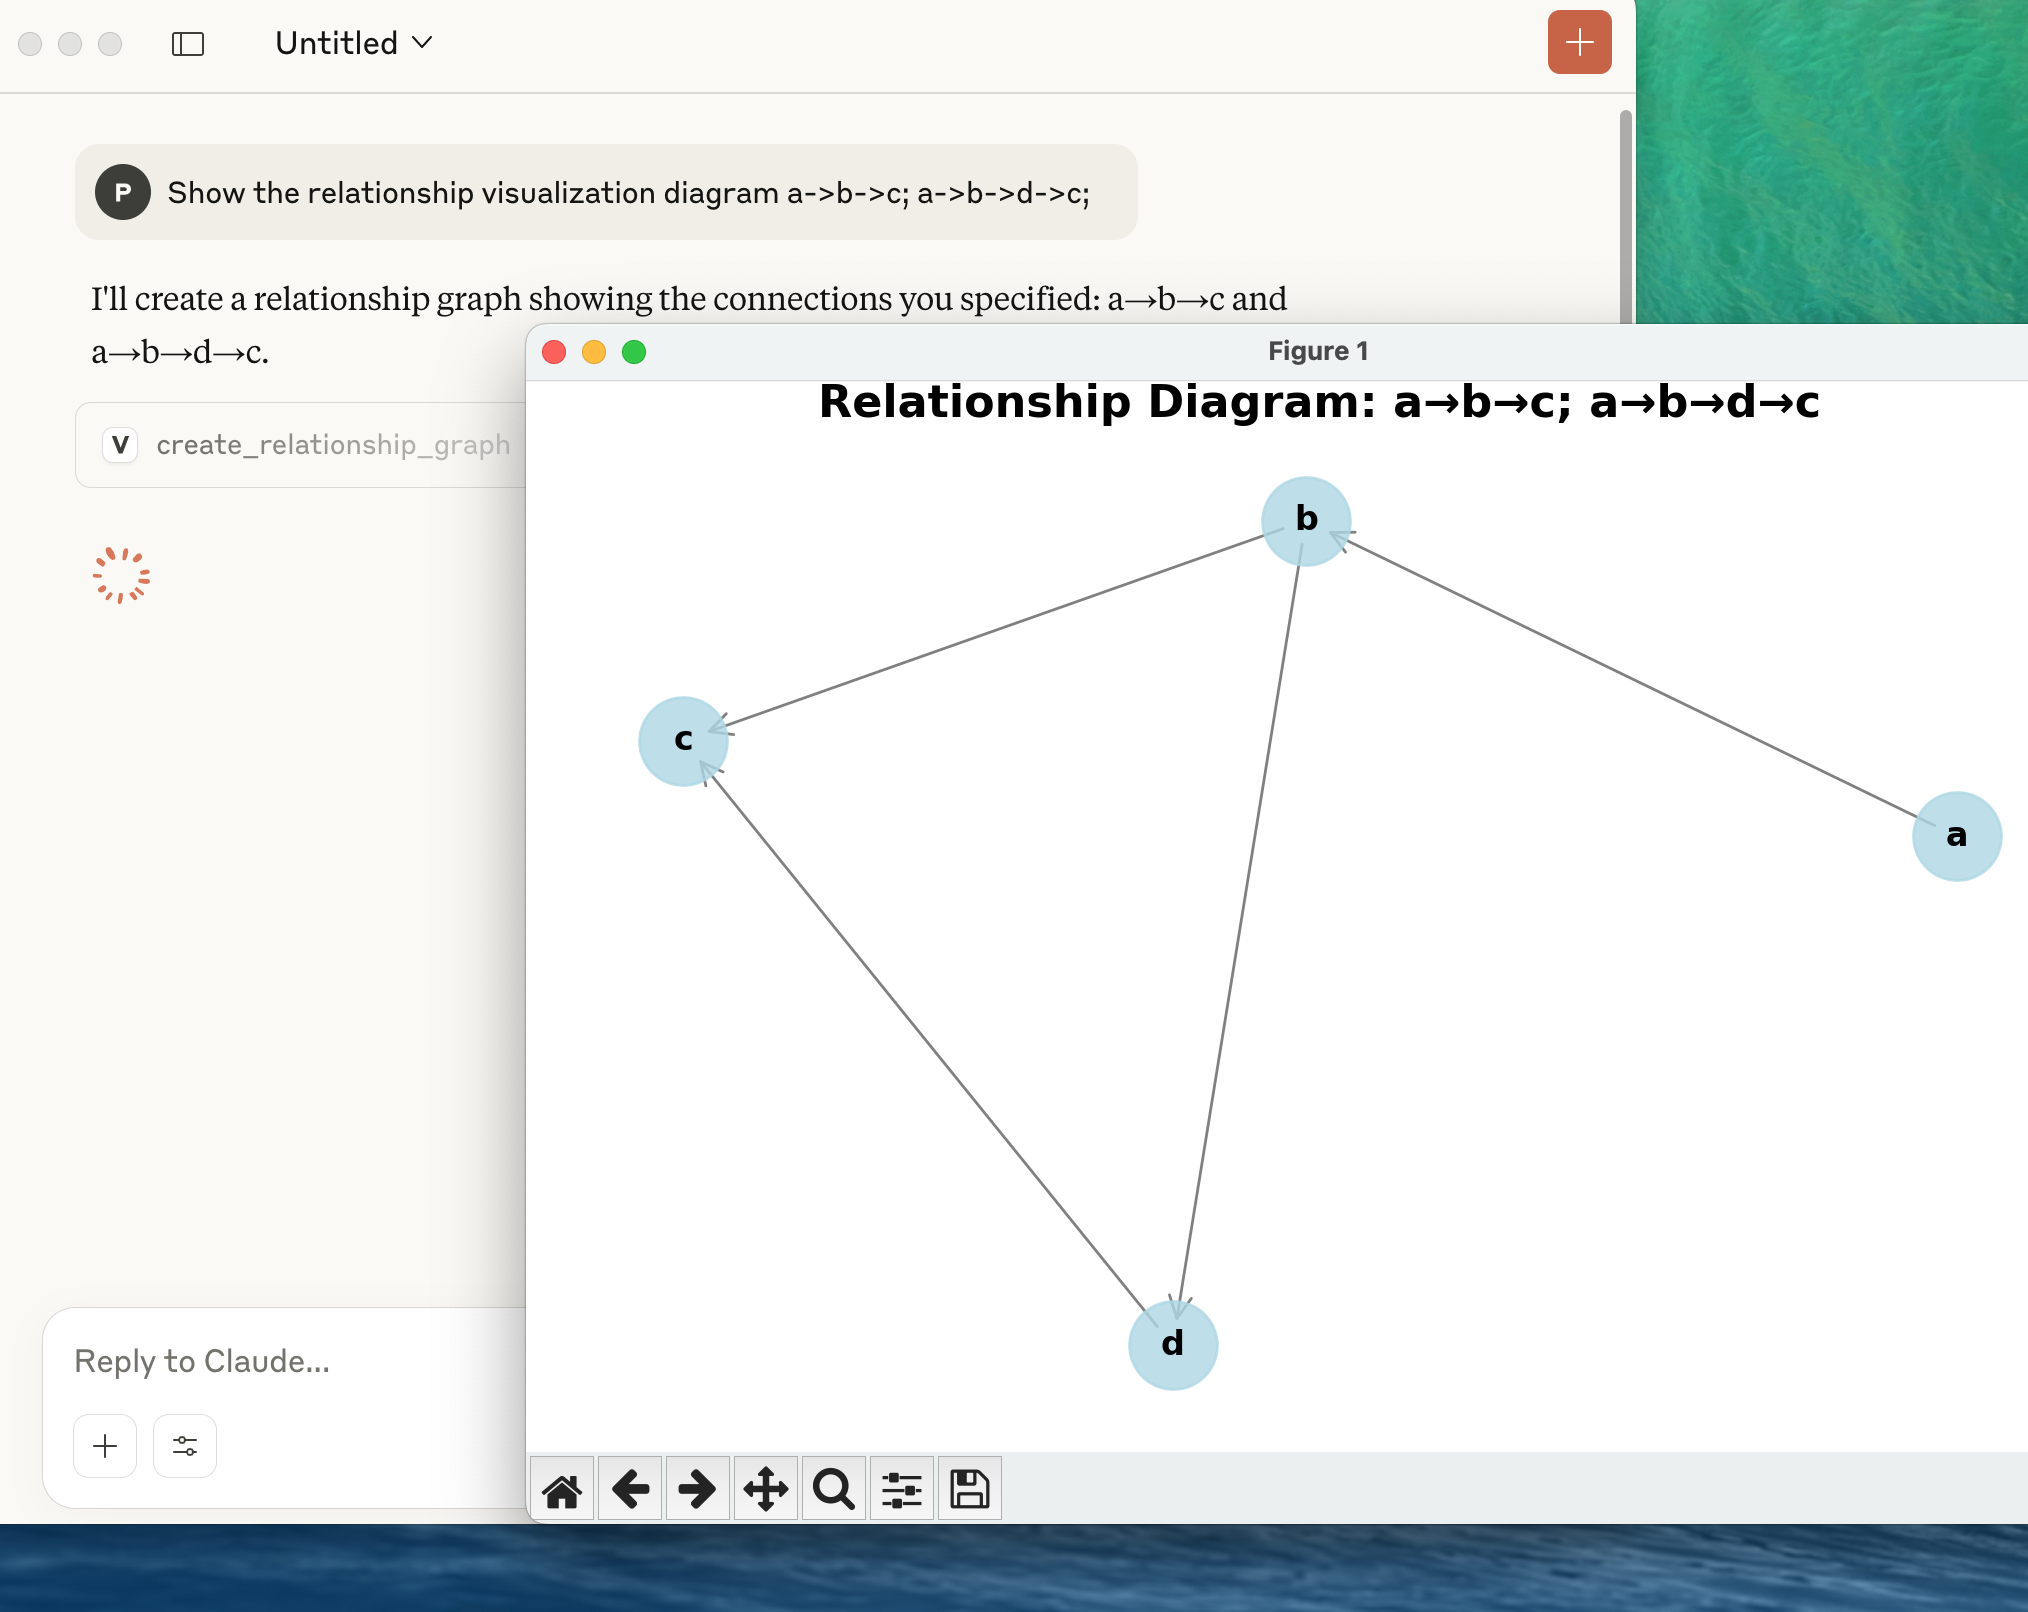
Create network diagrams to show relationships between entities:
# Example: Show relationships between A, B, C, D
nodes = ["Alice", "Bob", "Charlie", "Diana"]
edges = [["Alice", "Bob"], ["Bob", "Charlie"], ["Alice", "Charlie"], ["Charlie", "Diana"]]

# Call: create_relationship_graph(nodes, edges, "Social Network")
Parameters:
nodes: List of node namesedges: List of connections (pairs of node names)title: Graph title (optional)node_size: Size of nodes (default: 1000)font_size: Label font size (default: 12)
2. Scatter Plot
Create basic scatter plots with optional labels and colors:
# Example: Basic scatter plot
x_data = [1, 2, 3, 4, 5]
y_data = [2, 5, 3, 8, 7]
labels = ["Point A", "Point B", "Point C", "Point D", "Point E"]

# Call: create_scatter_plot(x_data, y_data, labels, title="My Scatter Plot")
Parameters:
x_data: X-axis valuesy_data: Y-axis valueslabels: Point labels (optional)colors: Point colors (optional)title,x_label,y_label: Chart labelssize: Point size (default: 50)
3. Classification Scatter Plot
Visualize data points grouped by categories:
# Example: Classification visualization
x_data = [1, 2, 3, 4, 5, 6]
y_data = [2, 3, 1, 5, 4, 6]
categories = ["Type A", "Type A", "Type B", "Type B", "Type C", "Type C"]

# Call: create_classification_plot(x_data, y_data, categories)
Parameters:
x_data: X-axis valuesy_data: Y-axis valuescategories: Category labels for each pointtitle,x_label,y_label: Chart labels
4. 3D Visualization
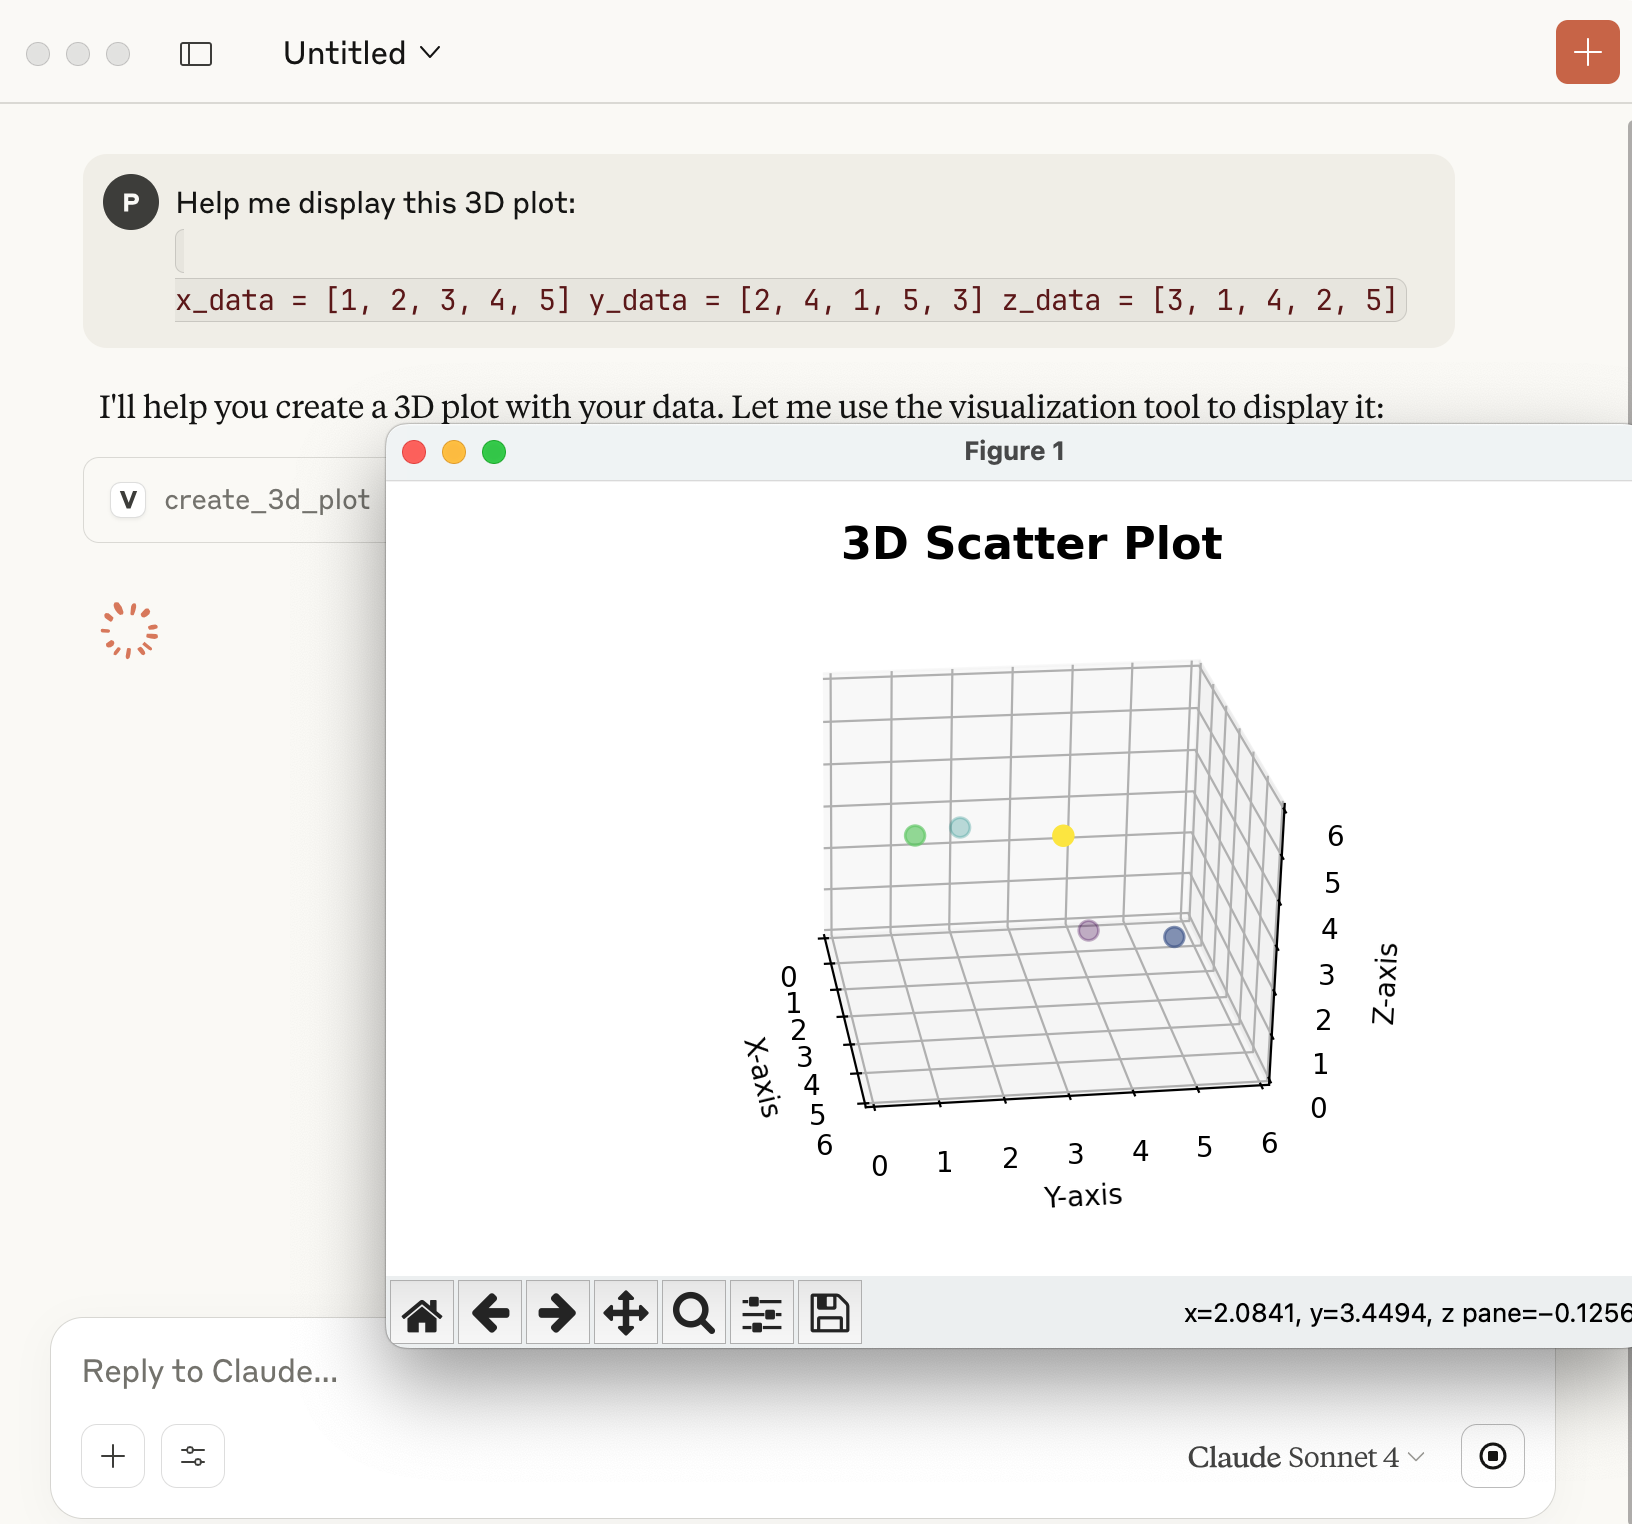
Create 3D plots with multiple visualization types:
# Example: 3D scatter plot
x_data = [1, 2, 3, 4, 5]
y_data = [2, 4, 1, 5, 3]
z_data = [3, 1, 4, 2, 5]

# Call: create_3d_plot(x_data, y_data, z_data, plot_type="scatter")
Parameters:
x_data,y_data,z_data: 3D coordinatesplot_type: "scatter", "surface", or "wireframe"title,x_label,y_label,z_label: Chart labels
5. Additional Charts
Histogram
# create_histogram(data, bins=30, title="Distribution")
Line Plot
# create_line_plot(x_data, y_data, line_style="-", color="blue")
Heatmap
# create_heatmap(data_matrix, x_labels, y_labels, colormap="viridis")
Output
Each visualization function:
- Displays the plot in an interactive matplotlib window
- Saves a high-resolution PNG file to the system temporary directory
- Returns the file path where the image was saved
Example output:
"Graph saved to: /tmp/relationship_graph_20250802_143022.png and displayed"
File Management
- Images are saved with timestamps to avoid conflicts
- Files are stored in the system temporary directory:
- Windows:
C:\Users\username\AppData\Local\Temp\ - macOS/Linux:
/tmp/
- Windows:
- High resolution (300 DPI) PNG format
MCP Integration
This server follows the Model Context Protocol standard and can be integrated with MCP-compatible clients. The server runs on stdio transport by default.
Server Configuration
if __name__ == "__main__":
    mcp.run(transport='stdio')
Examples
Social Network Analysis
# Visualize social connections
nodes = ["Alice", "Bob", "Charlie", "Diana", "Eve"]
relationships = [
    ["Alice", "Bob"],
    ["Bob", "Charlie"],
    ["Charlie", "Diana"],
    ["Alice", "Eve"],
    ["Eve", "Diana"]
]
# Creates a network graph showing social connections
Data Classification
# Visualize machine learning results
features_x = [1.2, 2.3, 1.8, 3.1, 2.9, 1.5]
features_y = [2.1, 3.2, 1.9, 4.1, 3.8, 2.2]
predictions = ["Class A", "Class B", "Class A", "Class B", "Class B", "Class A"]
# Creates a classification scatter plot
Scientific Data
# 3D scientific visualization
x_coords = [0, 1, 2, 3, 4]
y_coords = [0, 1, 4, 9, 16]
z_coords = [0, 1, 8, 27, 64]
# Creates a 3D surface or scatter plot
Error Handling
The server includes comprehensive error handling:
- Invalid data format detection
- Missing parameter validation
- Matplotlib rendering error recovery
- File system permission checks
Contributing
- Fork the repository
- Create a feature branch (
git checkout -b feature/amazing-feature) - Commit your changes (
git commit -m 'Add amazing feature') - Push to the branch (
git push origin feature/amazing-feature) - Open a Pull Request
License
This project is licensed under the MIT License - see the LICENSE file for details.
Dependencies
matplotlib: Core plotting librarynetworkx: Graph/network visualizationnumpy: Numerical computationspandas: Data manipulationmcp: MCP server framework
Roadmap
- Interactive plot widgets
- Animation support
- Export to multiple formats (SVG, PDF)
- Custom color schemes
- Statistical analysis integration
- Real-time data streaming plots
Support
If you encounter any issues or have questions:
- Check the Issues page
- Create a new issue with detailed description
- Include sample data and error messages
Made with ❤️ for the MCP ecosystem
Installing Visualization
This server has no published package — it is built from source. Open the repository and follow its README.
▸ github.com/xlisp/visualization-mcp-serverFAQ
Is Visualization MCP free?
Yes, Visualization MCP is free — one-click install via Unyly at no cost.
Does Visualization need an API key?
No, Visualization runs without API keys or environment variables.
Is Visualization hosted or self-hosted?
Self-hosted: the server runs locally on your machine via the install command above.
How do I install Visualization in Claude Desktop, Claude Code or Cursor?
Open Visualization on unyly.org, pick your client tab (Claude Desktop, Claude Code, Cursor) and press Install — the config is generated automatically, no JSON editing.
Related MCPs
GitHub
PRs, issues, code search, CI status
 by GitHub
Filesystem
Secure file operations with configurable access controls.
Memory
Knowledge graph-based persistent memory system.

Unyly Deploy
Deploy sites and MCP servers to Unyly straight from your AI agent
 by Unyly
Amap Maps Mcp Server
MCP server for using the AMap Maps API
 by duxiaohui
PayMCP
Lightweight payments layer for MCP servers: turn tools into paid endpoints with a two-line decorator. [PyPI](https://pypi.org/project/paymcp/) · [npm](https://w
 by blustAI
Server For Power BI
Enables exploring Microsoft Fabric / Power BI workspaces and semantic models, and executing ad-hoc DAX queries.
 by Mitsubishi-Fuso
Gpt Image 2 Mcp
RunAPI GPT Image 2 MCP server for image generation: create tasks, poll results, and check pricing across 1 model from Claude Code, Codex, Cursor, and VS Code.
 by runapi-ai
Template MCP Server
A CLI tool to create a new Model Context Protocol server project with TypeScript support, dual transport options, and an extensible structure
 by mcpdotdirect
Supabase
Database, auth and storage
 by Supabase
Compare Visualization with
Not sure what to pick?
Find your stack in 60 seconds
Author?
Embed badge for your README
Browse similar
All development MCPs